1 Background
This is a PlatON performance test report. The test was conducted by benchmarking to EOS, a well-known public chain, by imposing the same testing methodologies under the same environment.
2 Performance Indicators
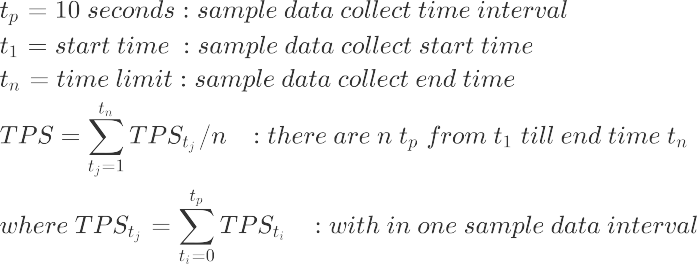
In this benchmark test, we focus on TPS, TTF and resource usages indicators. Data is collected every 10 seconds during sampling, when the average value of each indicator would be calculated at end of each sampling period. Take TPS for example:
2.1 Time to Finality (TTF)
The transaction delay is the time taken for the transaction to be finally validated across the network. Typically [1] considers the TTF as consisting of two components:


In this test, we calculate the TTF based on the block interval plus the time taken to reach its irreversible finality as stipulated in the consensus mechanism. In subsequent tests, we will conduct a more detailed test analysis of the time delay from the generation of each transaction to its eventual irreversibility.
2.2 Transactions per Second (TPS)
TPS is the number of transactions processed by the system per second, denoted in units of transactions per second. Transactions need to be successful, meaning they are packaged in a block and have a successful receipt execution.
With block data, we count the total number of transactions in blocks generated per unit time frame (typically 1 second) as the TPS.
2.3 Resource Occupancy Ratio
Resource indicator refer to the amount of system resources consumed under workload, including CPU, memory, disk storage, and network traffic.
CPU
CPU indicator refer to the CPU utilization rate of the system.
Memory
Memory indicator refer to the memory usage of the system.
Disk Storage
This indicator refers to the increase in disk storage of the system.
Network Throughput
Network throughput is the amount of data that passes through a network per unit of time without a network failure. The unit is Byte/s.
3 Testing Tools
In real-life scenarios transactions are generally sent to the chain through the RPC interfaces of different blockchain nodes, but using RPC interfaces to send transactions during performance testing can have the following problems:
1. In reality, the number of nodes receiving transactions through the RPC interface is so large and widely distributed that it is difficult to simulate in measurements.
2. If transactions are sent through only a small number of nodes, the performance bottleneck is often at the RPC interface, resulting in failure to simulate sufficient test pressure.
3. The vast majority of transactions received by consensus nodes in real-life scenarios are received via P2P broadcasts between nodes, rather than through their RPC interfaces.
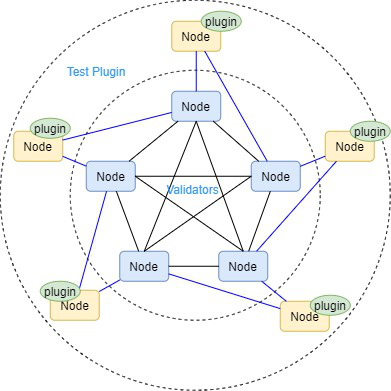
Therefore, this test implements a test plug-in specifically designed for performance testing, which generates transactions directly in the plug-in and broadcasts them to the consensus node via P2P broadcasting to minimize impact on performance by the RPC interface.
The basic process for testing via plugin is.
1. Initializing test accounts to simulate large numbers of concurrent users
2. Structuring test transactions and randomly selecting test accounts for signatures
3. Sending transactions
EOS has implemented a txn_test_gen_plugin plugin for Dawn 3.0 performance testing, but the txn_test_gen_plugin plugin only supports the transfer of tokens between the two built-in test accounts, which cannot meet the needs of a large number of concurrent users and multiple transaction testing, this test was done on an enhanced txn_test_gen_plugin.
Due to the implementation differences between PlatON and EOS systems, there are some functional differences between the PlatON test plug-in and EOS test plug-in used in this test, mainly in that the test account and its token allocation of PlatON is built directly in the Genesis block, while the test account and its token allocation of EOS is initialized in the test plug-in. In addition, due to PlatON’s interface, the PlatON test plug-in can directly access and more accurately collect statistics of TPS, while the EOS test TPS is through the analysis of block data for statistics.
4 Test Environment
This test uses AWS’s c5d.4xlarge server, Intel(R) Xeon(R) 8124M 16-core 3.0GHz, 32G RAM, 300G SSD hard drive.
The default number of consensus nodes per round for PlatON is 25, while the default number of consensus nodes per round for EOS is 21.
For active accounts, on the one hand, the total number of accounts affects the size of the blockchain DB to some extent, and the overhead is generally different for different amounts of data in the process of reading and writing; on the other hand, blockchain transactions generally use off-chain signature chain verification mechanisms, and the number of active accounts (accounts that send transactions per unit of time) determines to some extent the node’s verification of different signatures. The size of the overhead. This test was performed using 8000 accounts on both systems.
5 Workload
Our objective is primarily to test the performance of the entire blockchain system, and hereby we select a few typical applications for benchmarking tests.
Native Token Transfers
Native Token transfer is the most basic feature of the blockchain system, representing the basic performance of the system.
Contract Token Transfers
In EOS, native token transfers are also implemented through built-in contracts, so it is reasonable to assume that token contract transfers carry the same performance as native token transfer transactions, and this test does not test the performance of token contract transfers alone.
In PlatON, contract tokens and native tokens have completely different internal implementations, and in this test, contract token transfers are implemented according to the ERC20 specification, and since PlatON supports both EVM and WASM, the EVM and WASM versions of the ERC20 contract are tested separately.
key-value Storage
The state in PlatON’s contract is stored in the storage MPT tree, while the state in EOS’s contract is stored in the Multi-Index Table. In order to compare and test the read and write performance of storage, we implement the key-value storage contract on EOS and PlatON respectively for performance testing.
6 Test Result
This test is a comparison test between PlatON and EOS, specific test tools, test scripts and test methods refer here.
6.1 Native Token Transfer
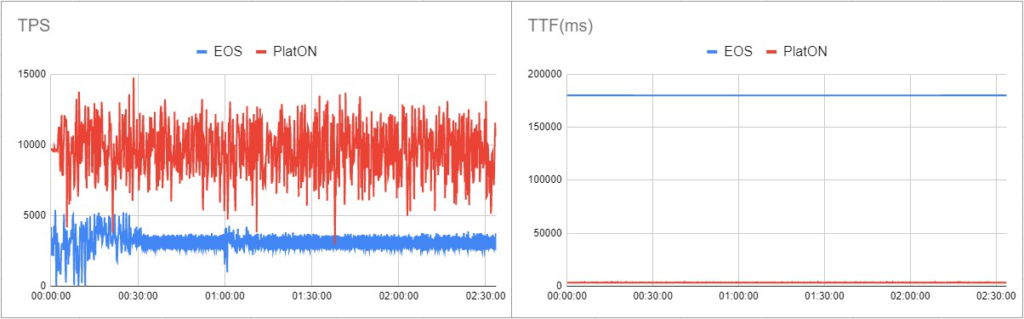
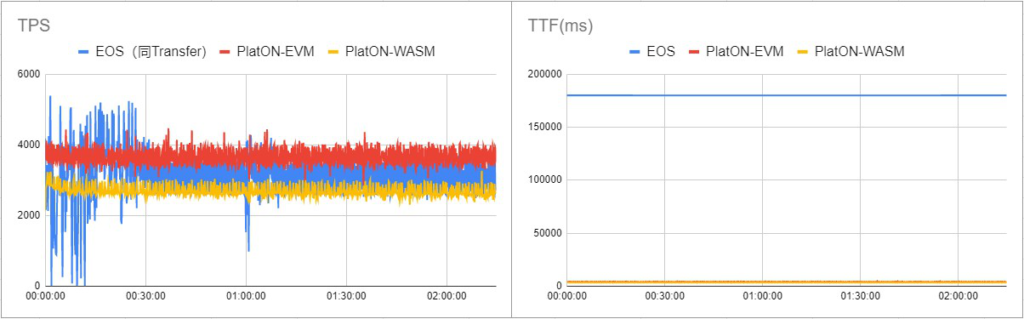
In the native token transfer performance test, the average TPS for PlatON transfers is 9604 tx/s with a maximum value of 14,755 tx/s, and the average TPS for EOS transfers is 3049 tx/s with a maximum value of 5393 tx/s.
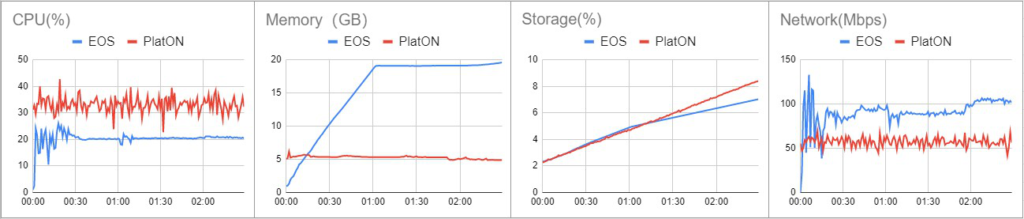
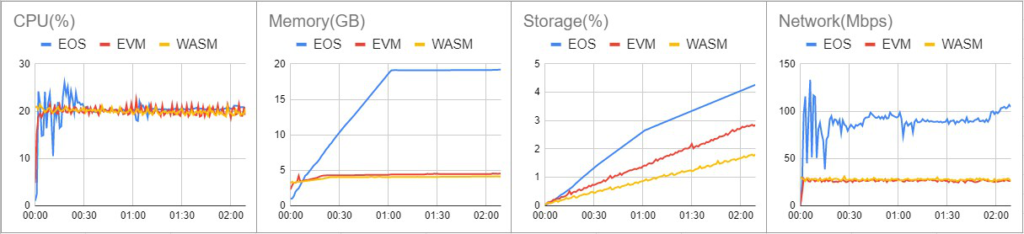
With little increase in CPU usage, PlatON performance is significantly better than EOS, due to PlatON’s parallel trading mechanism that greatly improves performance.
PlatON’s memory and network resource consumption is much lower than EOS, and as seen in Figure 3, the overall storage consumption during testing was similar for both, but on average, PlatON’s storage consumption is much lower than EOS when averaged over transactions.
Both PlatON and EOS are stable in terms of transaction confirmation time. The condition for each block in PlatON to reach final confirmation is that two subsequent children and grandchildren blocks are voted to confirm. According to EOS [2], each round by 21 nodes in turn to propose block, each node continuous production of 12 blocks, each block to reach the final confirmation need to go through two rounds, each round need to collect at least 15 nodes of indirect confirmation, that is, each block at least need to wait for the subsequent 15 x 12 x 2 = 360 blocks to final confirmation, according to the EOS average block interval time is 0.5 second, the calculation gives a final confirmation time of 180 seconds, which is longer than PlatON.
6.2 Contract Token Transfer
In the performance test of token transfer, the average TPS for PlatON-EVM token transfer is 3658 tx/s, and the maximum value is 4470 tx/s. The average TPS for PlatON-WASM token transfer is 2693 tx/s, and the maximum value is 3266 tx/s. Since the EOS token contract implementation is the same as the native token implementation, the EOS data in this comparison is the same as the native token transfer, with an average TPS of 3049 tx/s and a maximum value of 5393 tx/s.
PlatON-EVM performance is slightly higher than EOS, and PlatON-WASM performance is relatively slightly lower, there are rooms for improvement.
PlatON consumes much less memory and network resources than EOS, and both consume about the same amount of storage.
Both PlatON and EOS are quite stable in terms of transaction confirmation time. EOS has to wait 360 blocks for final confirmation so it’s TTF is longer than PlatON.
6.3 key-value Contract
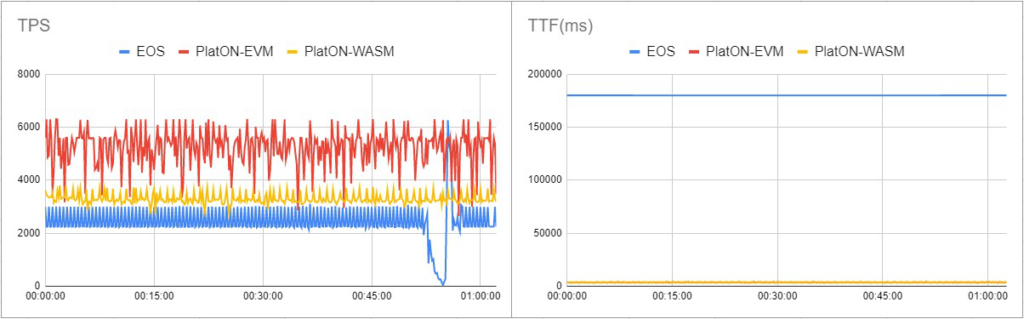
In the performance test of key-value contract transfer, the average TPS for Platon-EVM is 5237 tx/s, and the maximum value is 6304 tx/s. The average TPS for PlatON-WASM is 3297 tx/s, and the maximum value is 3797 tx/s. The average TPS for EOS is 2451 tx/s, with a maximum value of 6268 tx/s.
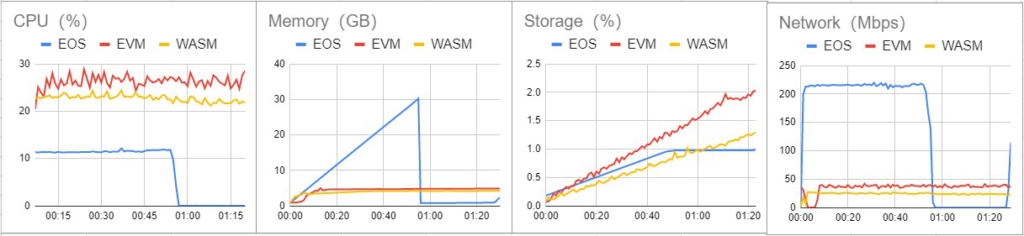
PlatON performance is significantly better than EOS, and CPU usage is also higher, indicating that PlatON is better utilized in multi-core CPUs.
PlatON consumes far less memory and network resources than EOS, and about the same amount of storage.
Both PlatON and EOS are more stable in terms of transaction confirmation time, with EOS blocks having to wait 360 blocks for final confirmation and TTF longer than PlatON.
The EOS consensus node memory grew during the test, resulting in memory exceeding the system limit and being killed by the OS, and a clear interrupt curve can also be seen in the above graph.
7 Conclusion
This comparison test between PlatON and EOS can be summarized as following.
1. Benefiting from a parallel DAG-based transaction mechanism, PlatON’s native Token transfer TPS outperforms EOS significantly .
2. On contract transactions, the performance of the two public chains are comparable. There could be room for further improvement in the performance of PlatON’s WASM contract.
3. Optimizations on the consensus mechanism have resulted in a much lower final confirmation time for PlatON than EOS.
4. PlatON is more efficient in utilizing CPU and consumes much lower memory and network overhead than EOS. During testing, the overall storage consumption is similar, but on average, PlatON consumes less storage than EOS.
5. During the test EOS’s process memory keeps rising, and finally been killed by system call up to a certain threshold, the specific reasons need to be further analyzed and clarified.
8 Reference
[1] Mengting Liu, Yinglei Teng, F. Richard Yu, “Deep Reinforcement Learning based Performance Optimization in Blockchain-Enabled Internet of Vehicle”, IEEE International Conference on Communications (ICC), 2019.
This article is reproduced from https://medium.com/platon-network/platon-performance-benchmark-6f9291f12526